From One Test to Many: Why “How You Sample” Matters
In the early 2000s, Takata was one of the world’s largest airbag manufacturers. Their inflators were tested routinely, passed specifications, and shipped globally.
But over the next decade, millions of those airbags ruptured during deployment, sending metal fragments into vehicle cabins, causing deaths and injuries. It became one of the largest recalls in automotive history.
What’s most troubling is that Takata did test these inflators, and the data looked fine. The company ran validation tests, production audits, and qualification builds. They collected data, but their sampling didn’t represent the real variation in materials, humidity exposure, or propellant aging. Takata’s internal testing and reporting often pooled inflators from different production lots and environmental conditions. When results were summarized in aggregate form, the influence of those factors and the real variation behind them was hidden inside averages. (Senate Commerce Committee Report pdf link)
Aside from any cultural or management issues within the company, they were collecting the wrong kind of data and summarizing it poorly. Takata’s problem wasn’t a lack of testing, it was a lack of understanding what their data represented. Even with variable measurement systems and large sample sizes, a failure of this scale still occurred. If a risk like this can make it through a launch process, what should we be doing differently?
The Next Step on the Test Continuum – Variable Responses and Distributions
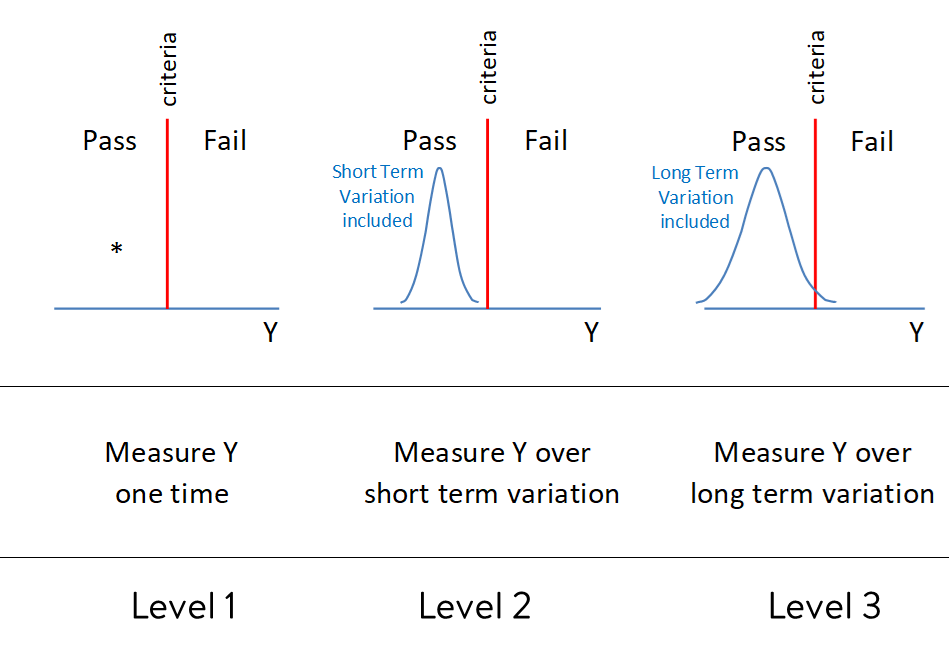
In the last article, we looked at level 0 “test to pass” systems that only record a binary outcome. This next stage looks similar on the surface, still evaluating to a pass criterion, but adds the crucial element of recording variable data from a representative sample. This article will apply to levels 1-3.
This shift allows variation to be studied. Studying variation is how we discover new knowledge. Everything exists on a gradient. Variation is always present, and truth is never fully known. A single outcome is never the whole story. What we’re after is understanding the system, not just confirming conformance.
When sampling is used to generate a distribution of results, the team can now understand both the spread of performance and its proximity to the threshold. But not all sampling is created equal, so next we’ll explore how to get those samples as well as how to think about sample size.
Why more data isn’t always better – Random vs. Rational Subgrouping
When planning a test, the common thinking is that more samples are always better. However, more doesn’t necessarily mean better, either for business ROI or for learning.
Random sampling aims to get an unbiased representation of the entire population when the process is stable. That means selecting units purely by chance so every one has an equal probability of being chosen. But in product development or test engineering, is a truly random sample even possible? Often it isn’t. The full population doesn’t yet exist, the logistics don’t allow it, and most importantly, it may not even provide the right kind of data to predict future performance.
Rational subgrouping, on the other hand, intentionally separates sources of variation. Samples are collected based on what was learned during process or product mapping—what factors are believed to create meaningful differences. To do this, you need to engage directly with the process or design. This “get to the gemba” mindset helps you identify what belongs within or between subgroups, and in doing so, builds a better cause-and-effect picture.
Both methods can produce a distribution, but only rational subgrouping captures and partitions the variation in a way that leads to understanding. Platforms like Twinmo make this easier by letting teams tag, trace, and compare data by source, lot, or condition—preserving the structure of the learning instead of flattening it into an average.
Is It a Good Test?
Referencing back to the first article of this series, we can evaluate this method using the same criteria for test sophistication.
Serve a clear purpose: Yes, though still a bit simple. Verify whether a distribution meets a threshold.
Inference that supports practical and statistical conclusions: Not yet. There’s limited ability to predict performance, highly dependent on test specifics and subject matter expertise.
Reflect real-world variation: Rarely. Only sample variation is captured; environment and use variation are often missing.
Connect to design or process decisions: Some learning is possible, but results can be misleading if sampling isn’t well-structured.
Return on investment: Minimal. Costs rise faster than the knowledge gained if testing isn’t connected to meaningful variation.
Overall, although it’s regarding the distribution this time this approach still only answers “Does it pass?” and doesn’t come close enough to the better question “How and why does it perform this way?”
Composite Flooring Example
An RV manufacturer faces rising demand and supply chain volatility. They want to validate a new secondary supplier for a composite flooring panel that must meet a flexural strength standard of 50 MPa before production approval.
Instead of testing a few panels and checking “pass/fail,” the team measures flexural strength from several panels across two production lots. This provides continuous data for analysis. They check process stability with control charts and compare both lot averages against the 50 MPa threshold.
Both Lot A and Lot B averages are above the threshold. A simple approach that looked only at averages would conclude success, but in reality, many individual panels would fail in use.
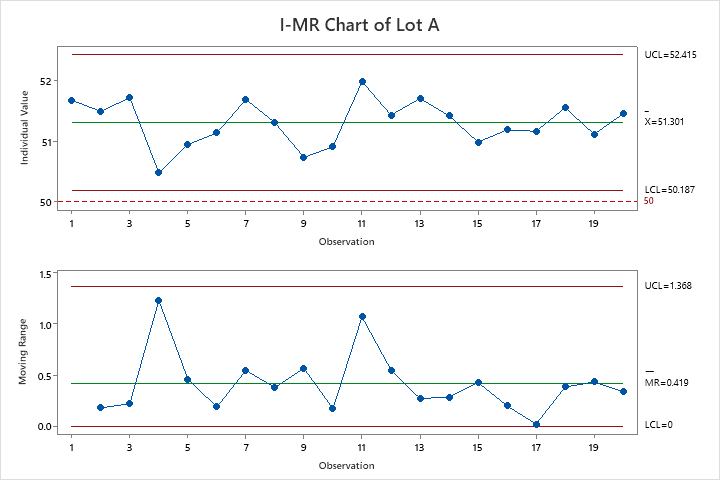
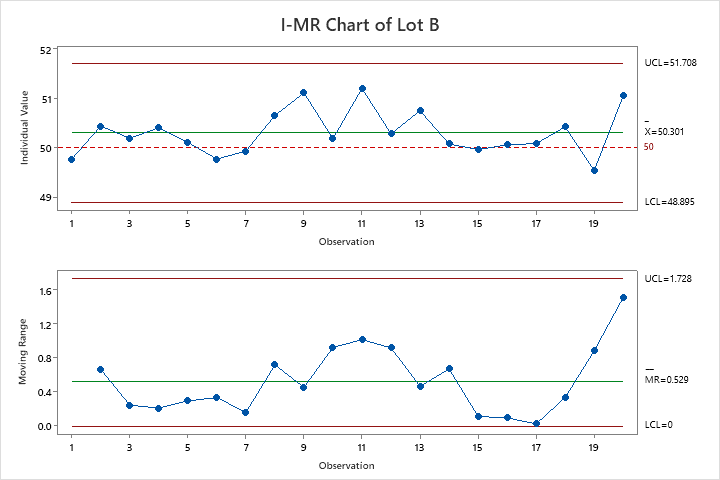
Since the team took the time to collect and plot variable data from two separate material lots they’re able to see that this supplier’s product is too near the threshold to be considered. The supplier’s process isn’t robust to material lot variation. Lot A would have been approved since the lower control limit is above the threshold, but we can clearly see Lot B performed much worse. Improvements would be needed before using them in production.
By collecting variable data and thinking critically about sampling, the team learns how and why the product performs, not just whether it passes. It’s a small step beyond pass/fail testing, but it dramatically improves the insights available for decision-making.
Beyond Pass/Fail
Takata’s engineers eventually discovered that inflators exposed to high humidity for long periods degraded the propellant and caused overpressure. The variation had been there all along, it was just masked by how data were grouped and summarized.
The lesson isn’t about airbags. It’s about the shift from testing to confirm toward testing to learn. If your data don’t reflect the real variation in your system, the lessons they offer will be shallow. And if your test data, context, and decisions aren’t connected, the insight you gain is temporary. Tools like Twinmo help teams retain that context so every test moves knowledge—and the system—forward.